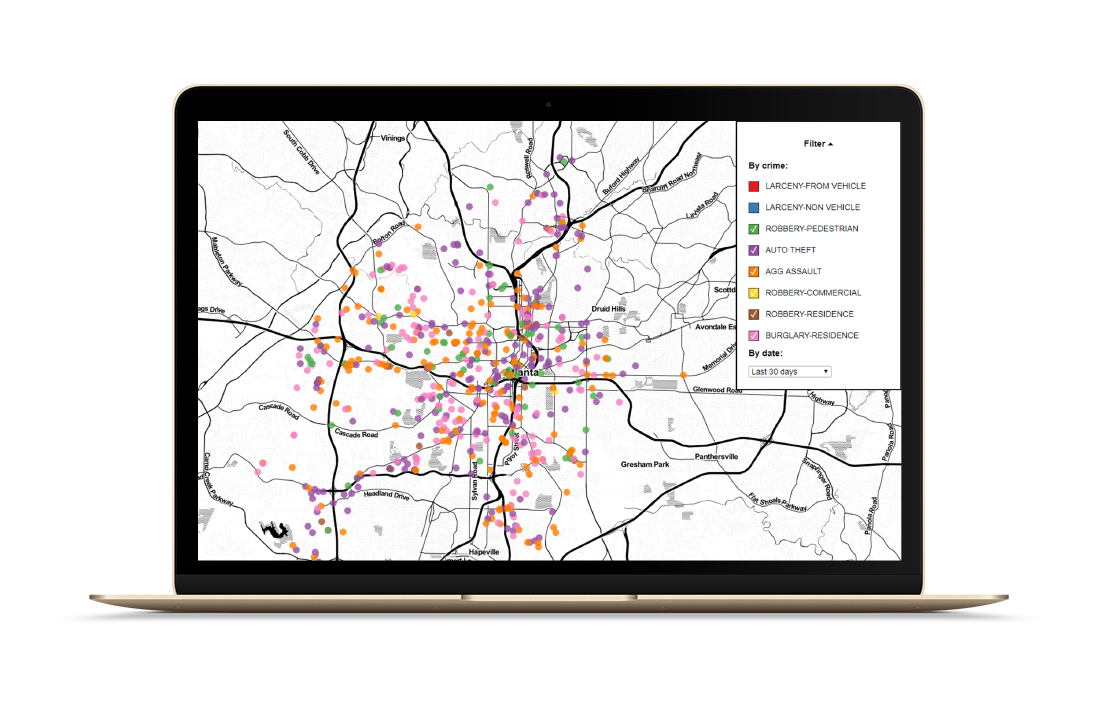
A data visualization mapping the crimes committed in Atlanta since January, 2019.
The visualization uses data from the Atlanta Police Department to plot every crime crime committed in Atlanta this year. The data can be filtered by the type of crime and the date committed. It's meant to be used by news consumers as well as a tool for journalists to analyze crime patterns. It's built with Leaflet.js, D3.js, and Open Street Maps. There's also a node script to automatically download, unzip, and parse the up-to-date data each week. Check out my Github repo for more information.
Created with D3.js, Leaflet.js, and Open Street Maps
Updated automatically with node.js
Can be filtered by date, and crime